
Market opportunity scoring is a method for ranking customer outcomes by importance and satisfaction, so product teams can find the gaps that matter most before writing a single roadmap item. The output is a ranked list of underserved needs, not a gut call dressed up in a spreadsheet. Teams run it when the idea backlog gets noisy, before a major launch, or when a mature product needs a fresh read on where value still hides.
TL;DR:
- Opportunity scoring is most effective when used to identify high-impact customer outcomes with significant satisfaction gaps across different segments.
- When adding market size to the scoring formula, ensure explicit normalization and segment differentiation to prevent misleading dominance of large but weakly differentiated markets.
- Using the score as the sole decision criterion is risky; instead, combine it with strategic fit, build hypotheses, and test with low-cost experiments before full development.
- Sample deliberately, including active, churned, and evaluating users, to uncover diverse gaps and avoid biased, overly optimistic results.
- Maintain transparency by keeping raw data, ratings, and segment details accessible to trace and defend score-based decisions.
What sets opportunity scoring apart from RICE and Kano
Opportunity scoring asks two questions about a customer outcome: how important is it, and how satisfied is the customer with the current solution? The gap between those two answers is the opportunity. This matters because it forces teams to score outcomes, not features. “Faster checkout” is a feature name. “Complete a purchase without re-entering payment details” is an outcome you can actually measure satisfaction against.
The approach traces back to Outcome-Driven Innovation, which built its case on the idea that customers hire products to get jobs done, and that scoring those jobs beats scoring feature wishlists.
It is worth being precise about what this tool is not. RICE (reach, impact, confidence, effort) ranks internal initiatives you have already decided to consider, weighing delivery cost against expected payoff. Kano sorts needs into categories, basic, performance, delighter, to explain why customers react the way they do. Value-versus-effort plots are a delivery triage tool, useful once you already know what you’re building. Opportunity scoring sits earlier in the process. It tells you what to consider before you decide how to build it.
How the scoring formula works and where it bends
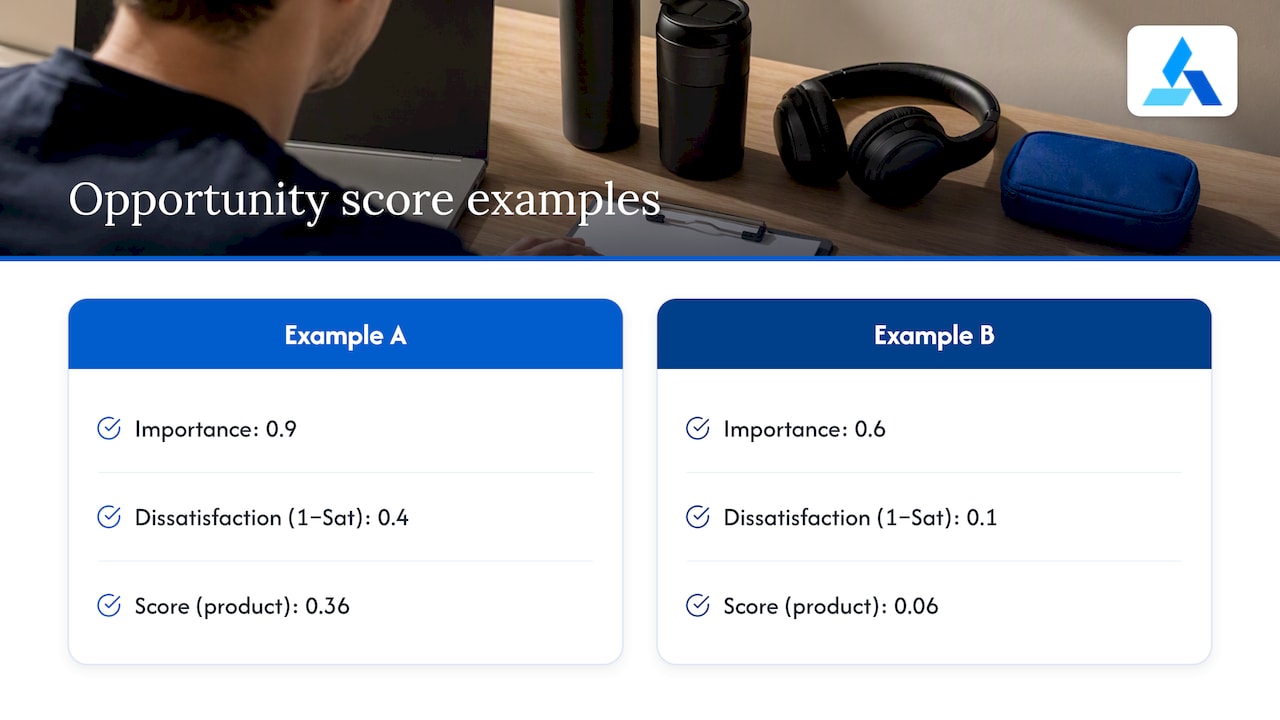
The canonical formula is simple: Importance times (1 minus Satisfaction). Rate both on a 1 to 5 Likert scale, normalize to a 0 to 1 range, and the math does the rest. Say customers rate an outcome 4.5 for importance and 2.0 for satisfaction. Converted to a 0 to 1 scale, that’s 0.9 importance and 0.4 dissatisfaction terms (1 minus 0.5), giving a score of 0.36. Compare that to an outcome rated 3.0 importance and 4.5 satisfaction: 0.6 times 0.1 equals 0.06. The first outcome is a real opportunity. The second is already solved.
Some teams add a market-size or revenue-weighted term: Importance times (1 minus Satisfaction) times Market size. This variant is common when comparing opportunities across different customer segments or geographies, according to product-management practice notes on opportunity scoring. It’s also where teams get sloppy. A review of opportunity-assessment methods from RTI recommends stating explicitly whether a market-size input is Total Addressable Market, Serviceable Addressable Market, or Serviceable Obtainable Market, and normalizing across segments so one oversized TAM number doesn’t swamp everything else in the ranking. Mixing a rough TAM estimate for one segment with a tight SAM figure for another produces a ranking that looks precise and means nothing.
When inputs mix qualitative comments with quantitative ratings, keep the numeric score and the rationale in separate columns. The score ranks; the comment explains. Losing that separation is how a defensible process turns into a black box nobody can defend in a roadmap review.
When opportunity scoring earns its place in your process
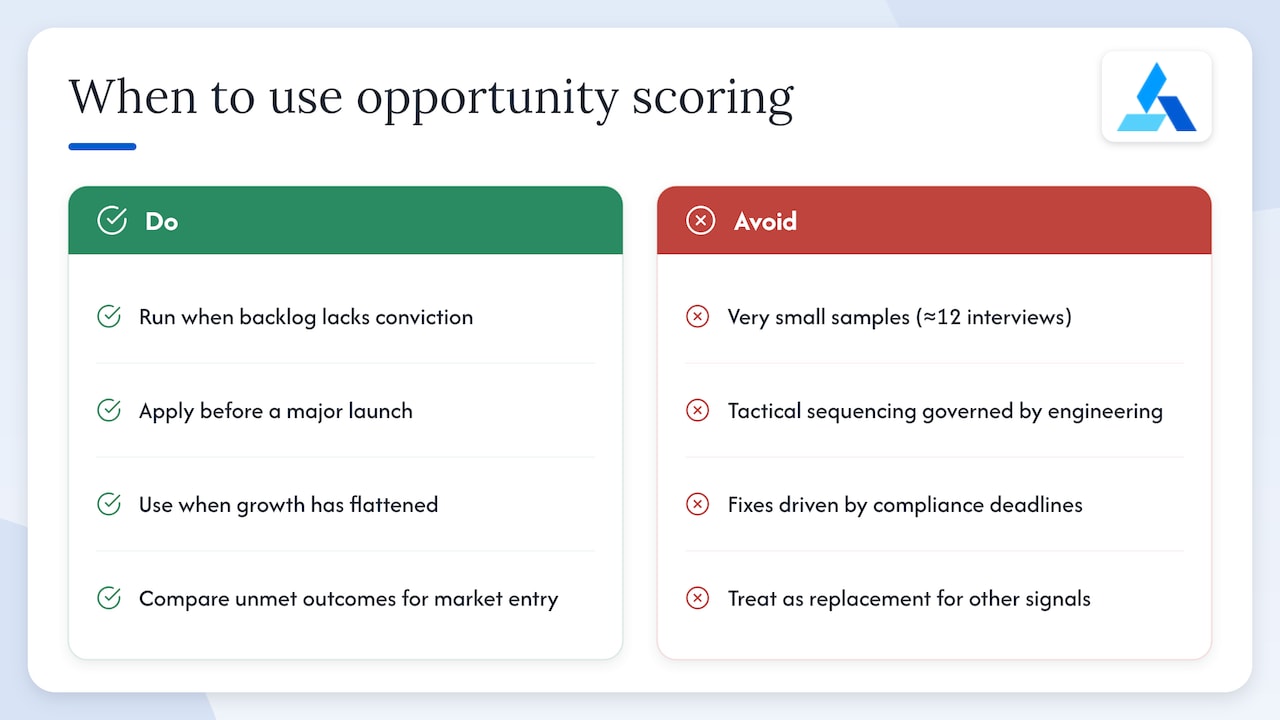
Run this when the backlog has more ideas than conviction, ahead of a major launch, or when a mature product’s growth curve has flattened and nobody’s sure why. It also earns its keep during market-entry decisions, when you need to compare unmet outcomes across segments before committing resources to one.
It’s the wrong tool for very small samples (a dozen customer interviews won’t support a reliable score), for tactical sequencing decisions where engineering dependencies already dictate order, or when a fix is dictated by a compliance deadline rather than customer preference.
Opportunity scoring also isn’t a replacement for other signals. Predictive opportunity scoring, the kind used in sales pipelines, works on a different job: forecasting deal outcomes from historical win and loss data. Microsoft’s implementation requires at least 40 won and 40 lost opportunities before a model can train, and it outputs a 1 to 100 score with trend and grade metadata rather than a customer-outcome ranking. Treat product opportunity scoring as the front end of discovery, feeding into analytics and interviews rather than replacing them.
Building a study that produces clean scores
The study design determines whether your scores mean anything. Five steps get you there:
- Define outcomes at the customer level. Write each one as a job to be done, not a feature: “reconcile monthly expenses in under ten minutes,” not “better reporting dashboard.”
- Write paired importance and satisfaction questions for every outcome, using the same Likert scale (1 to 5 works well) so responses are directly comparable.
- Sample deliberately. Include active users, lapsed users who churned, and prospects who evaluated but didn’t buy. Each group surfaces different gaps, and a single-segment sample will flatter whatever you already believe.
- Clean the data before scoring. Flag missing pairs, strip outliers that suggest a rushed respondent, and run a handful of follow-up interviews to sanity check any outcome with a surprising score.
- Segment where it matters. A blended score can hide a smaller, high-value niche with an outsized gap. Cutting by plan tier or use case often reveals the sharpest opportunity in the data.
A 2025 methodology paper on market-opportunity scoring makes the same point from a different angle: separate evidence collection from the scoring step itself, keep calculations deterministic and traceable, and treat imperfect data as something to handle incrementally rather than a reason to delay the whole exercise.
From ranked scores to a roadmap you can defend
Once scores are in, plot them on a simple heat map: satisfaction on one axis, importance on the other. The upper left quadrant, high importance and low satisfaction, is your whitespace. Everything else is either already served or not worth the effort.
- Cluster related outcomes together before ranking, since three narrow outcomes that all point at the same underlying job inflate the appearance of opportunity.
- Select the top candidates by score, but weigh them against strategic fit and what your team can actually build in the next planning cycle.
- Turn the top pick into a falsifiable claim: “If we cut reconciliation time for finance managers by half, renewal intent rises.” That sentence tells you exactly what to test.
- Adjust for market size only after the outcome ranking is settled, so a large but weakly differentiated segment doesn’t override a smaller segment with a sharper unmet need.
- Check capacity and dependencies before committing. A capacity-aware approach to portfolio prioritization keeps a strong score from turning into an overcommitted quarter.
A short worked example: say your top three scored outcomes are faster reconciliation, clearer error messages during payment failures, and self-serve refunds. Rather than building all three, you’d draft one hypothesis and one minimal experiment per outcome, then run the cheapest test first, likely the error-message fix, before committing engineering time to the other two.
Where scoring goes wrong and how to keep it honest
The most common mistake is scoring feature names instead of outcomes, which quietly reintroduces the bias the method was built to remove. A close second is over-weighting a market-size multiplier built on a soft TAM estimate, which can make a mediocre opportunity look dominant. The third, and most damaging, is treating the score as the decision itself rather than an input to one.
Guard against this by preserving the evidence behind every score, the raw ratings, the segment, the sample size, and by phrasing each shortlisted opportunity as a falsifiable claim before you build anything. Guidance on staged AI adoption recommends predefining the single assumption you’ll test for each top candidate, so a promising score doesn’t quietly become a foregone conclusion. Small, low-cost experiments beat big bets on an untested ranking, a point covered in more depth in practical validation guidance for founders.
Pro Tip: Publish the confidence level next to every score, not just the number, and schedule the follow-up experiment before the meeting where you present the ranking ends.
How Blue Prysm structures a traceable opportunity assessment
Blue Prysm runs opportunity scoring inside a seven-stage Market Opportunity Assessment Workflow, moving from evidence gathering through scoring to a decision checklist, so the rationale behind a number is never separated from the number itself. The platform’s Decision Engine keeps raw evidence and calculated scores in distinct layers, which means a reviewer can trace any ranking back to its source data instead of taking a score on faith. Deliverables include a one-page opportunity brief, a Venture Quick Score, and a decision checklist built for the same staged discipline this article recommends.
Using scores responsibly in product strategy
Teams get into trouble the moment a score starts substituting for judgment instead of informing it. The number tells you where to look, not what to decide. The discipline that actually protects you is boring: write down the assumption behind the top score, name the cheapest test that could break it, and keep the raw evidence next to the number so anyone can check your work six months later. That habit outlasts any particular scoring model.
— Colin Bowdery
Put opportunity scoring to work with Blue Prysm
Running a clean opportunity study by hand, sampling, Likert design, segmentation, heat mapping, takes real time away from building. Blue Prysm’s Market Analysis Platform handles the market-side inputs (competitor tracking, real-time signals, and a Venture Quick Score) so your team spends less time assembling spreadsheets and more time testing the top-ranked opportunity.
For teams that want the workflow without building it internally, a sample analysis shows the kind of one-page opportunity brief the platform produces, and the pricing page lays out the Starter, Pro, and Enterprise plans for teams ready to run this on an ongoing basis. Founders working through a specific market-entry question can also book a research conversation to walk through a live example.
Sources
- Lead and opportunity scoring | Microsoft Learn
- A Practical Guide to Opportunity Assessment Methods (RTI)
- Peer-reviewed-indexed article on Opportunity Market methodology (2025)
FAQ
How do I calculate the opportunity score?
Rate each customer outcome on importance and satisfaction using the same scale, then apply Importance times (1 minus Satisfaction) to get the score. A high score means the outcome matters a lot and current satisfaction is low, which marks it as underserved.
Can you give me an example of lead scoring?
Lead and predictive opportunity scoring, used in sales contexts, works differently from product opportunity scoring: it trains a model on historical won and lost deals and outputs a score, typically on a 1 to 100 scale, along with trend and grade indicators. That model needs a substantial training set, at least 40 won and 40 lost opportunities, before it produces a reliable score.
What is opportunity scoring and how does it work?
Opportunity scoring ranks customer outcomes by the gap between how important they are and how satisfied customers currently feel about them. Teams collect paired importance and satisfaction ratings through a survey, calculate the gap for each outcome, and use the ranked list to decide what to build next.
Can you give me an example of a market opportunity?
A market opportunity shows up as a customer outcome rated high in importance and low in satisfaction, for example, customers who rate “reconciling expenses quickly” as critical but rate their current tool’s speed poorly. That gap, not the feature idea itself, is what the score is measuring.