
Market analysis for SMBs lets you estimate your realistic market size, name the two or three customer segments worth chasing, and walk away with a short list of strategic moves instead of a gut feeling. Done right, it blends free federal data from the SBA and the Census Bureau with a small amount of your own customer research. This guide walks through that exact process.
TL;DR:
- Conducting targeted market analysis can be done with basic free government data and a small number of customer interviews, making it accessible for SMBs.
- Setting specific research questions, defining clear boundaries, and establishing success criteria beforehand prevent wasted effort and biased interpretations.
- Segmenting customers into two or three well-defined groups based on demographics, behavior, or needs improves the accuracy of market size estimates.
- Regularly revisiting competitive metrics like pricing, channels, and customer sentiment helps SMBs stay aligned with market shifts and competitive positioning.
- Using simple tools such as Census data, Google Trends, and basic surveys enables small teams to validate demand, size markets, and make informed decisions without expensive software.
Why market analysis matters for SMBs and when to run it
Most owners skip market analysis because it sounds like something a corporate strategy team does with a six-figure budget. That’s a trap. Skipping it doesn’t remove the risk, it just hides it until you’ve already sunk the cash into inventory, ad spend, or a lease.
Done properly, market analysis lowers your risk of building something nobody wants, gives you a defensible reason to charge what you charge, and sharpens your positioning so your marketing stops sounding like everyone else’s. It also forces a kind of discipline that gut instinct never will: you’re forced to write down what you believe about your customers and then check it against reality.
You don’t need to run a full analysis every quarter. A handful of moments call for it specifically:
- Launching a new product or location: you need a fresh read on demand and competition before you commit capital.
- Considering a pivot: you’re testing whether an adjacent market is actually bigger or easier to win than your current one.
- Building a growth plan: you need numbers that back up the plan, not just ambition.
- Raising money or applying for financing: lenders and investors expect a market section that isn’t fluffy.
There’s a broader reason this matters beyond your own business. Small businesses, defined as firms with fewer than 250 employees, accounted for 51% of net job creation in the United States between the third quarter of 2020 and the third quarter of 2025. Small firms are the engine, and engines that run on guesswork stall more often than they should.
Define research goals, scope, and hypotheses
Before you touch a single spreadsheet, write down what you’re actually trying to learn. Vague goals like “understand the market” produce vague, useless research. Specific goals produce specific, usable answers.
Start by converting your business questions into research questions you can actually test. “Should we expand into a new city?” becomes “How many households within 15 miles of our target location match our customer profile, and how many competitors already serve them?” That’s a question you can answer with data.
- Write two or three research questions, each narrow enough to answer with a number, a range, or a clear yes or no.
- Set your geographic scope, whether that’s a zip code, a metro area, or a national online market.
- Define your customer boundary, meaning the specific type of buyer you’re studying, not “everyone who might buy this.”
- Set a timeline, because a market snapshot from three years ago tells you almost nothing about demand today.
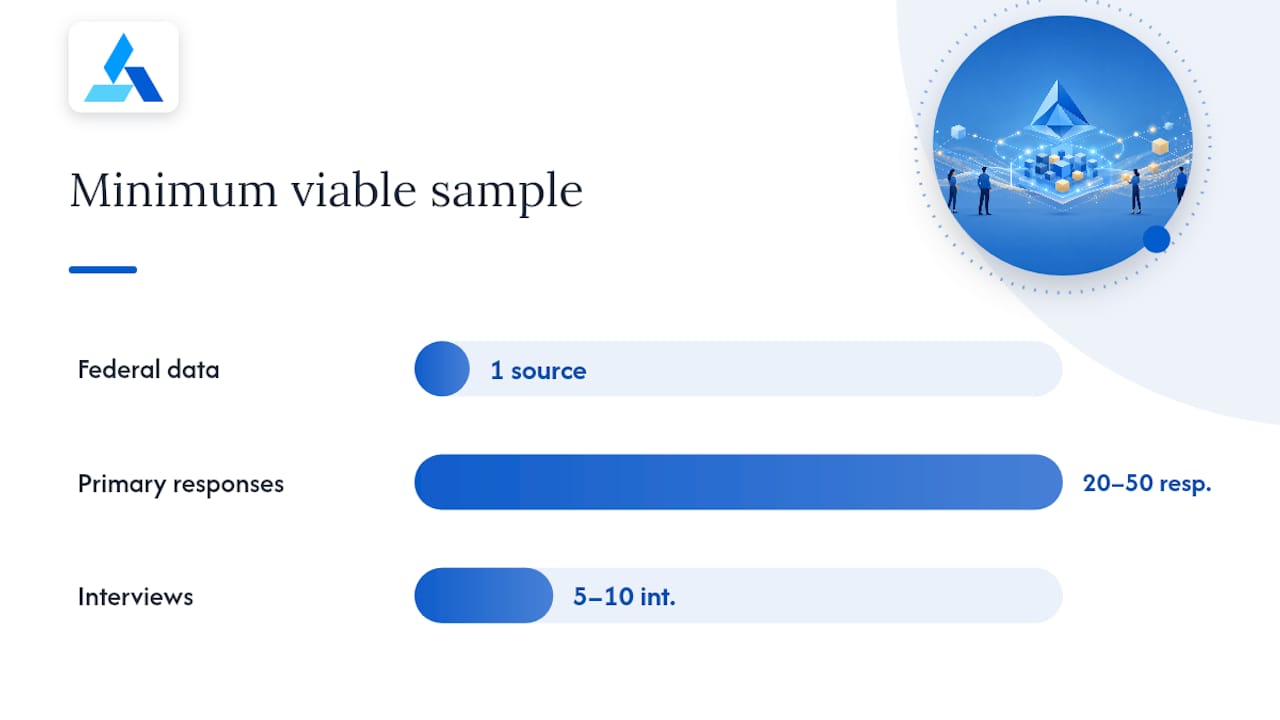
- Decide your minimum viable sample, the smallest number of data points that would let you act with confidence.
That last point trips up a lot of small teams. You don’t need statistical significance at the level a national retailer would want. A combination of one solid federal data source and 20 to 50 targeted primary responses, including five to ten interviews, is often enough for a business decision at SMB scale.
Set your success criteria before you start collecting data, not after. Decide in advance what result would make you move forward, what result would make you pause, and what result would make you walk away. Otherwise, you’ll be tempted to interpret ambiguous results as whatever answer you were hoping for.
Pro Tip: Write your hypothesis on a sticky note before you start research, then check afterward whether the data proved it, disproved it, or left it genuinely unclear. That discipline stops confirmation bias before it starts.
Identify and segment your target customers
You can’t analyze “the market” as one blob. You need two or three defined groups you can actually describe, target, and measure.
Segmentation typically works along three lines. Demographic segmentation groups customers by age, income, business size, or industry. Behavioral segmentation groups them by how they buy, how often, and through which channel. Needs-based segmentation groups them by the specific problem they’re trying to solve, which is often the most useful lens for a small business because it maps directly to your pitch.
If you sell to other businesses, the NAICS code system maintained by the Census Bureau is worth learning. It classifies businesses by industry, and once you know which NAICS codes describe your ideal customer, you can pull business counts for that code in your target geography directly from Census data tools.
From there, a simple three-layer estimate gets you a workable market size:
- Total Addressable Market (TAM): everyone who could theoretically buy what you sell, at the broadest reasonable definition.
- Serviceable Addressable Market (SAM): the slice of TAM you can actually reach given your geography, channel, and current capacity.
- Serviceable Obtainable Market (SOM): the realistic slice of SAM you could capture in the next one to three years given your resources and competition.
None of this requires expensive software. A spreadsheet, a Census business count, and a reasonable estimate of your capture rate will get you a defensible number.
Before you spend money building for a segment, validate it cheaply. A short survey sent to your email list or posted in a relevant online community can surface willingness to pay in a matter of days. A handful of informal advisory calls with people who fit your target profile, offered a coffee or a small gift card in exchange for 20 minutes, often reveals more nuance than a formal survey ever will. The goal isn’t proof, it’s confidence high enough to justify the next step.
Primary research methods SMBs can run cheaply
Secondary data tells you what’s true about the market broadly. Primary research tells you what’s true about your specific customer, and for an SMB, that’s often the more valuable half.
Three methods cover most SMB needs, and each fits a different kind of question.
- Surveys work best when you need to quantify something across a decent-sized group, such as how many people would pay a given price or how often they encounter a problem. Keep them under ten questions and lead with the easiest ones.
- Interviews work best when you need to understand why someone behaves a certain way, not just what they do. A 20 to 30 minute conversation with five to ten people in your target segment usually surfaces the same handful of themes by the fifth or sixth call.
- Observation works best when people’s stated preferences and their actual behavior diverge, which happens more than most owners expect. Watching how customers actually move through your store, website, or checkout flow often contradicts what they’d tell you in a survey.
A sample survey question might read: “On a scale of 1 to 5, how frustrating is it to find [specific service] in your area right now?” A sample interview question might read: “Walk me through the last time you tried to solve this problem. What did you actually do, step by step?” Notice that both ask about behavior and specifics rather than hypothetical future intent, since people are far more accurate describing the past than predicting themselves.
Cost and time run low if you keep scope tight. A ten-question survey distributed through email or social channels can be built and launched in an afternoon, and results start showing patterns within a week. Interviews take longer to schedule but rarely need more than two weeks for five to ten conversations if you’re offering a small incentive.
When you interpret the results, look for repetition rather than certainty. If six out of eight interviewees mention the same frustration unprompted, that’s a real signal even though eight people is a small sample. If your survey responses split evenly three ways, that tells you your segment isn’t unified enough yet, and you likely need to narrow it further before building anything.
Pro Tip: Record interviews with permission and transcribe the key quotes. Reading five interviews back to back surfaces patterns your memory alone will miss.
Competitive analysis: what to map and the metrics that matter
Competitive analysis answers a different question than market research. Market research tells you whether the demand exists. Competitive analysis tells you how hard it will be to win a share of it, and what you need to do differently to earn that share.
Start by identifying who you’re actually up against. Direct competitors solve the same problem for the same customer the same way you do. Indirect competitors solve the same problem differently, sometimes with a workaround that doesn’t look like a competitor at all until you dig in. NAICS codes can help you find direct competitors registered in your industry, while a quick search for how your target customer currently solves their problem often surfaces the indirect ones.
Once you’ve got a list, collect the same handful of metrics for each:
- Price: what they charge, and whether that includes hidden fees or add-ons you’d need to disclose too.
- Channels: where they sell and how customers find them, whether that’s search, social, retail, or referral.
- Sentiment: what customers say in public reviews, forums, and social comments about what’s missing.
- Features: what’s included in their core offering versus what’s an upsell.
- Distribution: how fast and how widely they can deliver relative to your own capacity.
A simple positioning map, plotting competitors on two axes like price and service depth, often reveals a gap faster than a written report would. A SWOT analysis for your top two or three competitors, done honestly rather than dismissively, tends to surface where you can compete offensively (a genuine advantage you can lean into) versus where you need a defensive move (a weakness competitors could exploit if you don’t shore it up first). A step-by-step competitor benchmarking walkthrough can help you build this out in more structured detail once you’ve got the basics mapped.
Pro Tip: Set a calendar reminder to recheck your top three competitors’ pricing and reviews every quarter. Competitive positions shift faster than most owners assume, and a positioning map from a year ago can quietly go stale.
Turn findings into decisions: market sizing, pricing, and positioning inputs
Research that never turns into a decision is just an expensive hobby. The final step is converting what you’ve learned into numbers and actions you can actually use.
For a back-of-envelope market size, multiply your target customer count (pulled from Census business or population data for your geography) by an average spend figure you’ve validated through your own primary research or industry benchmarks. That gives you a rough TAM. Apply your realistic reach, based on channel and capacity, to get SAM, and apply a conservative capture rate, often in the low single digits for a new entrant, to get SOM.
For pricing, triangulate three inputs: what competitors charge, what your primary research suggests customers are willing to pay, and your own cost structure with the margin you need to sustain the business. When those three don’t align, trust the willingness-to-pay data over your assumptions, since that’s the one number that came directly from the people you’re trying to sell to.
From there, write three decisions you can actually commit to, each with a KPI attached so you know whether it worked.
- A go or no-go decision on the market or segment, tracked against a KPI like signed customers or qualified leads in the first 90 days.
- A pricing decision, tracked against a KPI like average deal size or conversion rate at the chosen price point.
- A positioning decision, meaning the specific angle you’ll lead with in marketing, tracked against a KPI like message-to-inquiry conversion or the split between direct and indirect competitor mentions in customer feedback.
Three decisions, three KPIs. That’s the entire output of a market analysis worth doing.
Common mistakes, limitations, and how to avoid them
Even a well-run analysis can mislead you if you fall into a few predictable traps.
- Sampling bias: talking only to your existing customers or your immediate network gives you a distorted picture. Deliberately seek out people outside your current circle, even if it takes more effort.
- Confirmation bias: treating ambiguous results as validation because you wanted the answer to be yes. Set your success criteria before you collect data, not after.
- Data paralysis: endlessly gathering more data instead of deciding. Set a hard stopping rule in advance, such as “after 30 survey responses and eight interviews, we decide,” and honor it.
- Stale data: treating a market snapshot from two or three years ago as current. Markets move, and a number that was true in 2023 may not hold in 2026.
A simple update schedule solves most of this: revisit your core market size estimate annually, recheck competitor pricing and positioning quarterly, and rerun a lightweight customer survey any time you’re considering a meaningful pricing or product change.
How AI and Blue Prysm’s platform speed SMB market analysis
Everything above works with a spreadsheet, a free Census account, and patience. What changes when you bring in an AI-powered platform is speed and repeatability, not the fundamentals.
Census data on business AI adoption shows national use hovering around 17% to 20%, with smaller firms adopting more slowly than larger ones. That gap is an opportunity for owners willing to move early rather than a reason to wait.
Blue Prysm’s platform maps directly onto the workflow in this guide:
- Real-time market ingestion replaces the manual pull-and-refresh cycle across Census, BLS, and other sources.
- Competitor tracking automates the metric collection covered in the competitive analysis section.
- A strategy library with more than 50 frameworks gives you a structured place to turn findings into a plan rather than a loose document.
The honest answer on when to use a platform versus doing it yourself: DIY works fine for a single, one-time market check. A platform earns its cost when you need to refresh the analysis monthly, track several competitors continuously, or keep a team aligned on the same live numbers rather than a static report. Blue Prysm’s own breakdown of real-time market analysis walks through that comparison in more detail. Either path is legitimate. Which one fits depends on how often you need the answer to change.
Step-by-step process for conducting the market analysis
Pulling the full guide into a single sequence, here’s the order that works best for most SMBs.
- Define your research goals and boundaries, including geography, customer type, and timeline.
- Segment your target customers into two or three groups you can describe specifically.
- Pull secondary data from Census, BLS, and SBA resources to size the market and check industry trends.
- Run primary research, combining a short survey with five to ten interviews.
- Map your competitors and collect price, channel, sentiment, feature, and distribution data on each.
- Reconcile your numbers into a conservative TAM, SAM, and SOM range.
- Write three decisions and three KPIs based on what you found.
- Set an update schedule so the analysis doesn’t go stale within a year.
Each step feeds the next. Skipping the goal-setting step is the most common shortcut, and it’s the one that causes the most wasted effort later, since a team without a clear question tends to collect data that answers nothing in particular.
Tools and software recommendations for data collection and analysis
You don’t need an expensive stack to run this process well. A few tools cover almost every step.
For secondary data, Census Business Builder and data.census.gov handle demographic and business-count pulls at no cost. For survey distribution, a free-tier tool like Google Forms or SurveyMonkey covers most SMB sample sizes without a subscription. For interview scheduling and notes, a simple shared document or spreadsheet is often enough, though a transcription tool speeds up review of recorded calls considerably.
For demand trend checks, Google Trends is free and requires no signup. For competitor tracking at scale, that’s where a platform like Blue Prysm’s market research tools start to outperform manual spreadsheet tracking, since continuous monitoring across multiple competitors is tedious to maintain by hand month after month.
If you want structured training on the methodology itself rather than just the tools, an external course such as Marketing Research Pro covers the fundamentals of research design in more depth than a single guide can.
The right stack depends on your volume. A one-time analysis needs almost nothing beyond free government data and a spreadsheet. A recurring, team-wide process benefits from dedicated software that keeps the data fresh without someone manually re-pulling it every month.
Techniques for trend analysis and forecasting
Trend analysis answers a simple question: is this market growing, shrinking, or holding steady, and how fast?
Start with year-over-year comparisons using BLS employment and industry data for your sector, since a sustained increase in employment within an industry usually signals expanding demand, while a decline signals contraction or consolidation. Layer in Google Trends data for your specific product or service category to see whether search interest is trending in the same direction as the employment data. When both agree, you’ve got a reasonably reliable signal. When they diverge, dig into why before you trust either one alone.
For forecasting, resist the urge to build an elaborate model. A simple trend line extended a year or two forward, adjusted down for known risks like seasonality or a looming regulatory change, beats a complex model built on assumptions you can’t defend. AI-assisted forecasting tools can help here, particularly in sectors like logistics where demand patterns are complex and repetitive. A resource like this explainer on AI demand forecasting covers how that accuracy improvement works in more technical detail for readers who want it.
The discipline that matters more than the tool: treat any forecast as a range, not a single number, and revisit it every quarter against actual results so you catch a wrong assumption early rather than a year later.
Methods for validating data accuracy and reliability
Bad data feels just as convincing as good data until it costs you money, so validation deserves its own step rather than an afterthought.
Start by checking the source and the date on every figure you use. A statistic from a trade association’s marketing page carries different weight than one from a government agency’s published methodology, and a number from three years ago may no longer reflect current conditions.
Cross-check any important figure against a second, independent source before you build a decision on it. If your Census-derived market size estimate and a paid industry report land within a reasonable range of each other, that agreement is reassuring. If they’re wildly apart, figure out why before you proceed, since the discrepancy usually traces back to different definitions of the market rather than one source simply being wrong.
For your own primary research, watch your sample composition as closely as your results. A survey of 40 responses that skews heavily toward one age group or one channel tells you less than a smaller, more representative sample would. Interview responses that repeat consistently across a diverse set of people are far more trustworthy than a single compelling anecdote.
Treat validation as ongoing rather than a one-time check. Data that was reliable at the moment you collected it can decay within months in a fast-moving market, so build a habit of spot-checking your core numbers against fresh sources every time you’re about to make a decision that leans on them.
Case studies or examples illustrating market analysis application in SMBs
Consider a small regional bakery deciding whether to open a second location. A quick pull from Census Business Builder shows household income and population density within a 15 minute drive of two candidate sites. BLS data confirms the local food service sector has been adding jobs rather than shedding them, a sign the area can support another entrant. A short survey sent to the bakery’s existing email list asks how far customers would be willing to drive for a second location, and the answers cluster tightly around a distance that rules out one of the two candidate sites entirely. That’s a real decision made with a few hours of free research rather than a hunch about foot traffic.
Or consider a small B2B software company weighing whether to expand into an adjacent industry vertical. NAICS-based business counts show the adjacent vertical has roughly the scale to justify the effort, and five customer interviews reveal that the core problem the software solves shows up just as often in the new vertical, just described with different vocabulary. That single insight, that the pain is the same but the language differs, becomes the entire basis for how the sales team repositions their pitch for the new segment.
Neither example required a consulting engagement or a six-figure research budget. Both required a clear question, a few free data sources, and a small amount of direct customer contact.
What I’ve learned reviewing SMB research habits
The businesses that get the most out of market analysis aren’t the ones with the biggest budgets. They’re the ones that ask a specific question, answer it with a small amount of real data, and then actually act on what they find instead of filing the report away. I’ve watched more owners talk themselves out of a good decision with an extra month of research than I’ve watched owners regret moving too fast on solid, if imperfect, data.
If you do nothing else this month, try this:
- Pull one Census data point about your target market this week.
- Talk to five real prospects or customers before month’s end.
- Write down three decisions you’ll make based on what you learn, before you learn it.
— Colin Bowdery
How Blue Prysm can help you move faster
Everything in this guide works with free tools and a weekend of focused effort. Where Blue Prysm fits in is speed and repeatability once you’re past the one-time check and into ongoing tracking. The platform pulls competitor data, market signals, and a library of over 50 strategy frameworks into one place, so refreshing your analysis becomes a monthly habit instead of an annual scramble.
If you’re deciding between building this yourself and letting a platform carry the recurring work, the Starter plan starts at $30 per month, with a $299 annual option, and gives you a low-risk way to see whether ongoing tracking earns back the hours it saves. Explore the market analysis platform to see what a live briefing looks like before you commit to anything.
Sources
The federal government publishes an enormous amount of market data for free, and most SMBs never touch it because they assume it’s either too complicated or reserved for economists. It isn’t.
Start with Census Business Builder, a free tool built specifically to help entrepreneurs pull demographic and business-count data for a chosen geography, useful for sizing a local market or comparing potential locations. From there, data.census.gov lets you dig deeper into population, income, and household data by zip code or county.
For labor and industry trends, the Bureau of Labor Statistics publishes employment counts, wage data, and industry growth figures broken down by sector and region, which helps you gauge whether an industry is expanding or contracting before you commit to it. The Bureau of Economic Analysis adds regional income and spending data that can sharpen a local market estimate further.
The SBA’s market research guidance is worth bookmarking on its own, since it treats market research and competitive analysis as two halves of the same job: research finds the customers and the demand, competitive analysis tells you how to win them. The SBA page also links out to templates and checklists you can adapt directly.
For a quick, free read on demand trends over time, Google Trends shows you whether search interest in your product category or a competitor’s brand is rising, flat, or falling in a given region, which is a fast way to sanity-check a hunch before you invest in deeper research.
Pull the pieces together like this:
The BLS reports that small firms accounted for 51% of net job creation between the third quarter of 2020 and the third quarter of 2025. That figure is a useful gut check when you’re evaluating whether an industry sector is still generating opportunity for smaller players or has consolidated toward large incumbents.
When two sources disagree, and they will, don’t average them and call it done. Instead, build a conservative range using the lower of the two figures as your floor and the higher as your ceiling, then plan around the floor. If your numbers still don’t reconcile after checking methodology and date ranges, that’s usually a sign the definitions differ (a “market” defined by NAICS code rarely matches a market defined by a trade association’s own criteria).
Paid industry reports earn their cost when you need data federal sources don’t track, such as brand-level market share in a niche category or forward-looking forecasts built on proprietary panels. For most local or early-stage SMB decisions, though, free federal data covers the essentials.
FAQ
What are the 5 C’s of marketing analysis?
Definitions vary depending on the source, but a common version covers Company, Customers, Competitors, Collaborators, and Climate (the broader market and regulatory environment). It’s a useful checklist for making sure your analysis hasn’t missed a major angle, though the segmentation and sourcing steps covered in this guide matter more than memorizing the acronym.
What should be included in a market analysis?
A solid market analysis includes your target customer segments, an estimate of market size, a review of direct and indirect competitors, and demand or industry trend data. The SBA’s guidance frames market research and competitive analysis as the two core halves of a complete picture.
How much is a business worth with $1,000,000 in sales?
Business valuation depends heavily on industry, profit margins, growth rate, and the valuation method used, so a single sales figure alone can’t determine worth. A business with revenue could be valued anywhere from a fraction of that figure to several times it, depending on profitability and the specific method a buyer or appraiser applies.
Is the SMB market worth it?
Small businesses, defined as firms with fewer than 250 employees, accounted for 51% of net job creation in the United States between the third quarter of 2020 and the third quarter of 2025, which suggests the sector remains an active source of opportunity. Whether it’s worth it for your specific business depends on the market analysis outlined in this guide, not on the sector’s size alone.