
Most mid-market teams should buy for at least the first eighteen months, then reassess with a hybrid lens once seat costs or renewal terms start to bite. The framework to apply is Differentiation × Stability × Scale, run across a 3- to 5-year total cost of ownership window rather than a first-year price tag. If your use case is differentiated, your requirements are still shifting, or your engineering team is already stretched, buy. If the workload is stable, high-volume, and central to how you win deals, build starts to make financial sense.
TL;DR:
- Teams should consider buying analytics if requirements are likely to change rapidly, or if the capability has a customer-facing, differentiating impact.
- Building analytics may remain cost-effective only when a proprietary model is necessary, requirements are stable, and the license cost avoidance justifies potential overruns.
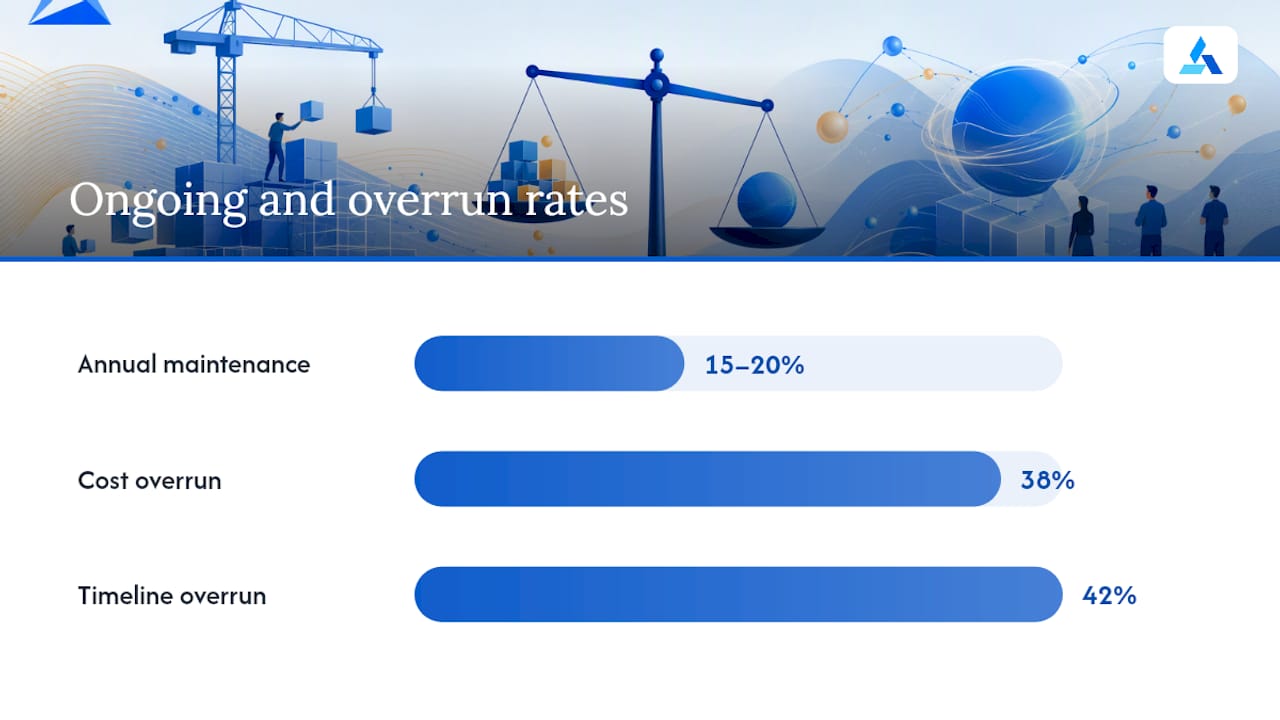
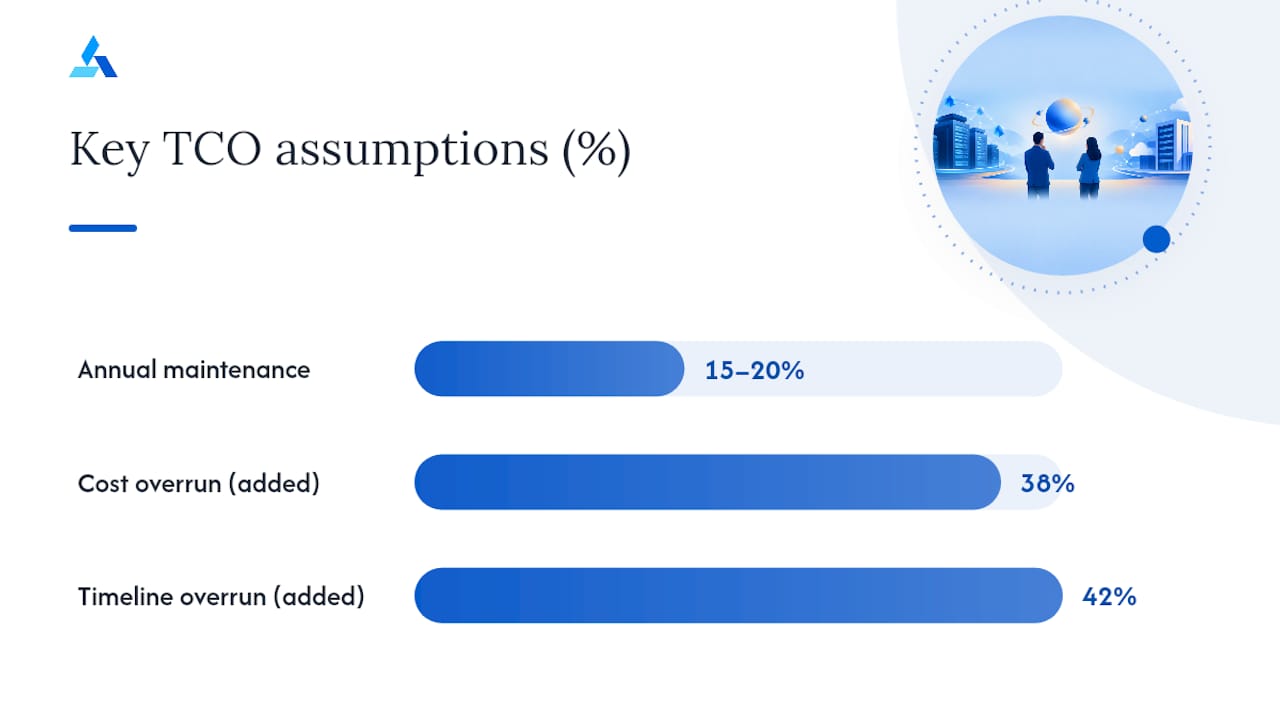
- Ongoing maintenance costs for in-house systems typically add 15 to 20 percent annually, with average costs overrunning initial estimates by 38 percent.
- Vendor proposals often exceed market rates by 18 to 34 percent, and renewal prices can escalate significantly over time, emphasizing the need for thorough benchmarking and negotiation.
- A hybrid approach—buy for core components and build the differentiating edge—can optimize cost and control when boundaries and ownership are clearly defined and managed.
Build vs Buy Analytics: The Framework and a Fast Checklist
The decision framework has four moving parts, and leaders who skip any one of them tend to talk themselves into the wrong answer.
Differentiation asks whether the analytics capability is something customers or investors actually notice, or whether it’s plumbing nobody outside engineering will ever see. Stability asks how likely your requirements are to still look the same in eighteen months. Scale measures the license or consumption cost you’d avoid by building, at your actual (not aspirational) seat count. Capacity is the honest inventory of who on your team would own this thing at 2 a.m. when it breaks.
A fifth factor, data sensitivity, cuts across all of it. Analytics touching regulated data changes the math regardless of how the other four factors line up.
Here’s a checklist to triage any specific use case before you build a model or call a vendor:
- Does this analytics capability show up in a sales deck or customer contract, or only in an internal dashboard?
- Have the requirements changed in the last two quarters, and are they likely to change again?
- What would three years of licenses or seat fees actually cost at your projected headcount?
- Do you have engineers who can own this long after the person who built it moves teams?
- Does the data include health, financial, or other regulated categories?
- Is there a commercial platform that covers 80% of the need out of the box?
- Would a delay of six to nine months materially hurt the business?
- Is this the kind of problem your competitors have already solved with the same vendor?
Score a use case “buy” if it’s commodity, unstable, or low in engineering capacity; for examples of vendor alternative assessment, see Intralinks Alternatives for Founders. Score it “build” if it’s differentiated, stable, and the avoided license cost is large. Everything in between is a hybrid candidate, and that’s usually most of the list.
Pros, Cons, and Hidden Costs of Building Analytics In-House
Building gives you full control over the data model, the roadmap, and the user experience. It also gives you full responsibility for every bug, every schema change, and every person who quits holding institutional knowledge nobody wrote down.
The initial build cost is the easy part to estimate. What consistently gets missed is the ongoing bill. Annual maintenance for a self-built analytics stack typically runs 15 to 20% of the initial build cost every single year, which means a $400,000 build can quietly cost $60,000 to $80,000 a year just to keep running, before anyone adds a new feature.
Statistic Callout: Post-mortem benchmarking of enterprise build projects finds average cost overruns of roughly 38% and timeline overruns of roughly 42% against the original estimate. If your business case assumes the build finishes on time and on budget, assume it won’t, and model the overrun in from day one.
Beyond the multipliers, three real risks show up every time:
- Knowledge concentration: the two or three engineers who understand the pipeline become a single point of failure.
- Integration debt: connecting a homegrown analytics layer to every new data source becomes a standing tax on the team, not a one-time cost.
- Opportunity cost: the roadmap time spent maintaining analytics infrastructure is time not spent on the product your customers actually pay for.
Building is justified when you have a proprietary model that competitors can’t buy off a shelf, when the analytics experience is genuinely customer-facing and differentiating, or when the license base you’d avoid is large enough that even a 38% overrun still beats renting forever.
Pro Tip: Before you approve a build, ask your engineering lead to name the two people who would own this system in three years. If they can’t, you’re not ready to build it.
Pros, Cons, and Hidden Costs of Buying Prebuilt Analytics
Buying gets you to a working answer fast, and the vendor carries the maintenance burden you’d otherwise inherit. That speed is the real advantage, not the sticker price.
The sticker price is also the least reliable number in a buy-side model. License or consumption fees are just the entry point. Implementation, customization, admin overhead, and the training it takes to get adoption above token usage all add up, and none of them show up in the vendor’s pitch deck.
Statistic Callout: Vendor pricing proposals commonly land 18 to 34% above prevailing market rates when checked against independent benchmarks. Any buy-side TCO built on the first quote you receive is very likely inflated before you’ve signed anything.
Renewal escalation is the other trap. Year-one pricing is rarely year-three pricing, and per-seat models punish exactly the kind of growth you’re hoping for.
- Benchmark every vendor proposal against market rate data before it enters your model, not after.
- Ask for a multi-year price lock or an escalation cap as a negotiation condition, not an afterthought.
- Track total seats and usage tiers quarterly so a renewal surprise never arrives as a surprise.
- Treat SaaS consumption with the same discipline you’d apply to cloud infrastructure, using FinOps guidance on tracking and optimizing recurring software spend.
Buying wins when speed-to-value matters more than customization, when the vendor’s roadmap already covers what you need, or when your engineering capacity is better spent elsewhere.
Hybrid Approaches: Buy Core, Build the Edge
Most sophisticated teams don’t pick one lane. They buy the commodity layer and build the narrow slice that actually differentiates them, and that split is where the best economics usually live.
The pattern looks consistent across industries: buy the data warehouse, the visualization layer, and the standard reporting pipeline; build the proprietary scoring model, the custom attribution logic, or the workflow tied directly to your specific product.
Drawing that boundary cleanly matters more than the split itself. A few rules keep hybrid architectures from turning into the worst of both worlds:
- Define ownership boundaries in writing before integration starts, not after the first outage.
- Keep the number of custom integration points with the vendor platform as small as possible.
- Assign one accountable owner for the “build” edge, even if it’s a fractional role.
- Revisit the boundary any time the vendor changes its API, pricing tier, or product direction.
The operational risk in hybrid setups isn’t the build or the buy piece individually. It’s the seam between them, the API contract, the data handoff, the version mismatch that breaks quietly. Treat that seam as its own line item in your risk register, with its own monitoring and its own owner, and the hybrid model tends to outperform either pure approach over a multi-year horizon.
How to Run a Build-vs-Buy TCO Analysis
A rigorous analysis compares build and buy on identical scope, over the same time horizon, using the same benchmarked assumptions on both sides. Skipping any one of those three conditions is how internal teams end up defending a decision they made on gut feeling months earlier.
- Define identical scope first. Write down the exact capability, data volume, and user count both options must deliver, and freeze it before you price anything.
- Set measurable success criteria. Decide what “working” means in hard numbers, query latency, uptime, adoption rate, before you compare a single dollar figure.
- Gather build-side inputs. Initial development cost, infrastructure, integration work, and annual maintenance at 15 to 20% of build cost.
- Apply the overrun multiplier. Take your engineering team’s honest estimate and add the empirical 38% cost and 42% timeline overrun before you compare it to anything.
- Gather buy-side inputs. Benchmarked vendor price (not the list price), implementation fees, admin overhead, training, and a renewal escalation assumption for years two through five.
- Choose a 36 to 60 month horizon. Formal ownership-economics modeling shows break-even windows commonly land between 21 and 33 months depending on assumptions, so a shorter window will systematically favor buying and a longer one will favor building.
- Calculate break-even. Plot cumulative build cost against cumulative buy cost month by month and find where the lines cross.
- Run sensitivity tests. Rerun the model with the overrun multiplier at 20% and at 60%, and with vendor escalation at 5% and at 20%, to see how fragile your conclusion actually is.
- Factor in opportunity and exit costs. Include what your engineers would otherwise build, and what it costs to migrate off a vendor if you buy and later switch.
- Pilot before you commit. Run a 60 to 90 day vendor trial or a scoped build spike against the same success criteria you defined in step 2, and let the pilot data, not the sales deck or the roadmap slide, decide the direction.
Pro Tip: Run the sensitivity test before you present to leadership, not after someone asks “what if the estimate is wrong?” in the meeting. You want to already have that slide.
Include people costs on both sides. A FinOps-style lifecycle accounting approach that captures training, adoption friction, and exit costs, not just license or salary lines, is usually what separates a defensible TCO model from a rough guess dressed up as one. For teams mapping which datasets belong in the pilot itself, a structured data inventory helps keep the scope honest.
Governance and Compliance When You Choose to Build
Building doesn’t just transfer engineering work to your team. It transfers regulatory and monitoring duties that a vendor would otherwise carry, and those duties don’t show up on a project timeline until something goes wrong.
The NIST AI Risk Management Framework organizes this obligation into four functions: govern, map, measure, and manage. Practically, that means someone on your team now owns data lineage documentation, provenance tracking, and bias monitoring for any model your analytics stack produces or consumes, indefinitely.
Statistic Callout: Annual maintenance on a self-built system already runs 15 to 20% of the initial build cost. Add governance monitoring, supplier risk assessment for any third-party components, and audit-readiness work, and the true “cost of ownership” line is almost always higher than the maintenance percentage alone suggests.
Two regulatory triggers change the calculus outright. When analytics handle protected health information, HIPAA compliance frequently favors a certified vendor solution over an in-house build that would need its own certification path. Federal agency work carries a similar FedRAMP burden that most internal teams aren’t staffed to clear.
A minimal governance checklist for any build: document data lineage from source to output, assign a named owner for model monitoring, run a supplier risk assessment on every third-party library or API you depend on, and schedule a recurring audit, not a one-time review at launch.
A Product Leader’s Take on Getting This Decision Wrong
The build-vs-buy debate rarely fails on the math. It fails because leaders anchor on list price instead of benchmarked price, and then act surprised when the vendor’s real cost lands 20 to 30% higher than the pitch deck promised.
The third mistake is quieter and more expensive: nobody reserves ongoing headcount for the thing they just built, so it survives on borrowed time from whichever engineer feels guilty about it.
Set a calendar reminder to re-run this analysis at every major renewal, whenever seat growth crosses a pricing tier, and after any architecture change on either side. The right answer at 50 seats is rarely the right answer at 500.
— Colin Bowdery
How Blue Prysm Supports Your Build-vs-Buy Decision
Running the TCO model above by hand in a spreadsheet works, but it’s slow, and slow is exactly what kills good decisions before renewal deadlines force a bad one. Blue Prysm’s Market Insights Software pulls real-time competitor and market data into the same workspace where you’re already building your decision framework, so benchmarking a vendor’s price against what the market actually charges takes minutes instead of a week of manual research.
If you’d rather have someone else stress-test the model with you, Blue Prysm’s AI Operational Audit reviews your current analytics stack, your build capacity, and your vendor contracts, and comes back with a scoped recommendation rather than a generic slide deck. Teams with a live renewal on the calendar tend to start there. For leaders building the framework themselves, the strategy library includes templates built for exactly this kind of comparison, and the platform’s pricing page starts at $30 per month for the Starter plan if you want to run the analysis inside the tool yourself. Book a look at the platform or start the Starter plan this week, before your next renewal notice arrives.
Sources
The NIST AI Risk Management Framework defines the governance functions that apply the moment you own an analytics system. VendorBenchmark’s build vs buy research supplies the overrun and vendor pricing multipliers used throughout this framework. FinOps for SaaS covers lifecycle cost accounting for recurring vendor spend. FW Delta’s ownership economics report models break-even timing across scenarios. HHS HIPAA guidance explains why regulated health data often tips the decision toward buying. For a broader primer, see Blue Prysm’s guide to data analytics decision-making.
- NIST AI Risk Management Framework
- VendorBenchmark — Build vs Buy decision benchmark
- FinOps — FinOps for Software-as-a-Service
- FW Delta — Software ownership economics report 2026
- U.S. Department of Health & Human Services — HIPAA
FAQ
What Is a Build vs Buy Analysis?
A build vs buy analysis compares the total cost and risk of developing analytics capability in-house against purchasing a prebuilt platform, over an identical scope and time horizon. The strongest versions include hidden costs like maintenance at 15 to 20% of build cost annually and benchmarked vendor pricing rather than list price.
Is It Better to Build or Buy Analytics?
For most mid-market teams, buying is the safer starting point because it delivers value faster and shifts maintenance risk to the vendor. Building only pulls ahead when the capability is genuinely differentiated, requirements are stable, and the avoided license cost is large enough to absorb a typical 38% cost overrun.
Which Is Better for Me, to Build or Buy Software?
Run the Differentiation × Stability × Scale framework against your specific use case rather than relying on a general rule. A use case that’s commodity, unstable, or short on engineering capacity should buy; one that’s differentiated, stable, and high in avoided license cost should build.
Is It Cheaper to Build or Buy Right Now?
It depends entirely on your time horizon and seat growth, not on which option looks cheaper in year one. Break-even windows commonly fall between 21 and 33 months, so a shorter comparison almost always favors buying while a 5-year comparison can favor either side depending on your specific cost inputs.
How Does Blue Prysm Help With This Decision?
Blue Prysm’s Market Insights Software benchmarks vendor pricing and market data in real time, which feeds directly into the TCO steps outlined above. Current plan pricing starts at $30 per month for Starter, with Pro and Enterprise tiers listed on the pricing page.