
RICE scores initiatives by multiplying Reach, Impact, and Confidence, then dividing by Effort. It gives product and project teams a repeatable way to rank features or projects competing for the same resources within the same goal and time window, rather than relying on whoever argues loudest in the roadmap meeting.
TL;DR:
- RICE scores are most effective for comparing multiple features or projects with shared goals and sufficient data for estimating reach, impact, confidence, and effort.
- Consistent and clearly defined measurement scales for reach, impact, and confidence are essential to ensure reliable and meaningful scores.
- The framework works best when scoring is done quarterly and involves collaboration across teams responsible for each input, with regular review and recalibration.
- RICE’s reliability diminishes when used to evaluate decision priorities outside of direct stakeholder comparison or when estimates are based on weak evidence.
- High scores indicate higher potential value relative to effort, but scores should always be treated as tools to facilitate discussion, not definitive verdicts.
What RICE is and why teams choose it over simpler methods
Intercom’s product team built RICE because gut-feeling prioritization kept favoring loud ideas over good ones. Their original framework added Reach as a fourth input specifically to stop teams from overvaluing a feature that only a handful of customers would ever touch. That is the whole conceptual shift: ICE scores Impact, Confidence, and Effort, but it has no mechanism to catch a brilliant idea that affects twelve users. RICE does.
The formula is Reach multiplied by Impact multiplied by Confidence, divided by Effort. Read it as total expected impact per unit of work. A higher number means more value for the time your team spends building it, which is the only comparison that matters when a roadmap has more good ideas than engineering weeks.
RICE earns its keep in a specific situation: several competing features, a shared goal (growth, retention, activation), and enough data to make reasonable estimates for each input. It falls apart when you try to force it onto decisions that are not really comparisons at all.
- Good fit: ranking a backlog of growth experiments against one quarterly objective
- Good fit: choosing between three retention features with overlapping engineering cost
- Poor fit: deciding whether to do mandatory security patching or compliance work
- Poor fit: scoring a single piece of infrastructure work with no competing alternative
If there is nothing to compare an idea against, you do not need a scoring framework. You need a decision.
Defining reach, impact, confidence, and effort so scores actually compare
RICE only works when every person scoring an item uses the same yardstick. Loose definitions are where most teams quietly destroy the model’s value.
- Reach is the number of users or events affected within a fixed time window, such as customers per quarter or transactions per month. Pick one window and hold every item to it; mixing “users this month” with “users this year” makes the whole backlog incomparable, a point GrowthMethod makes explicitly when contrasting RICE with ICE.
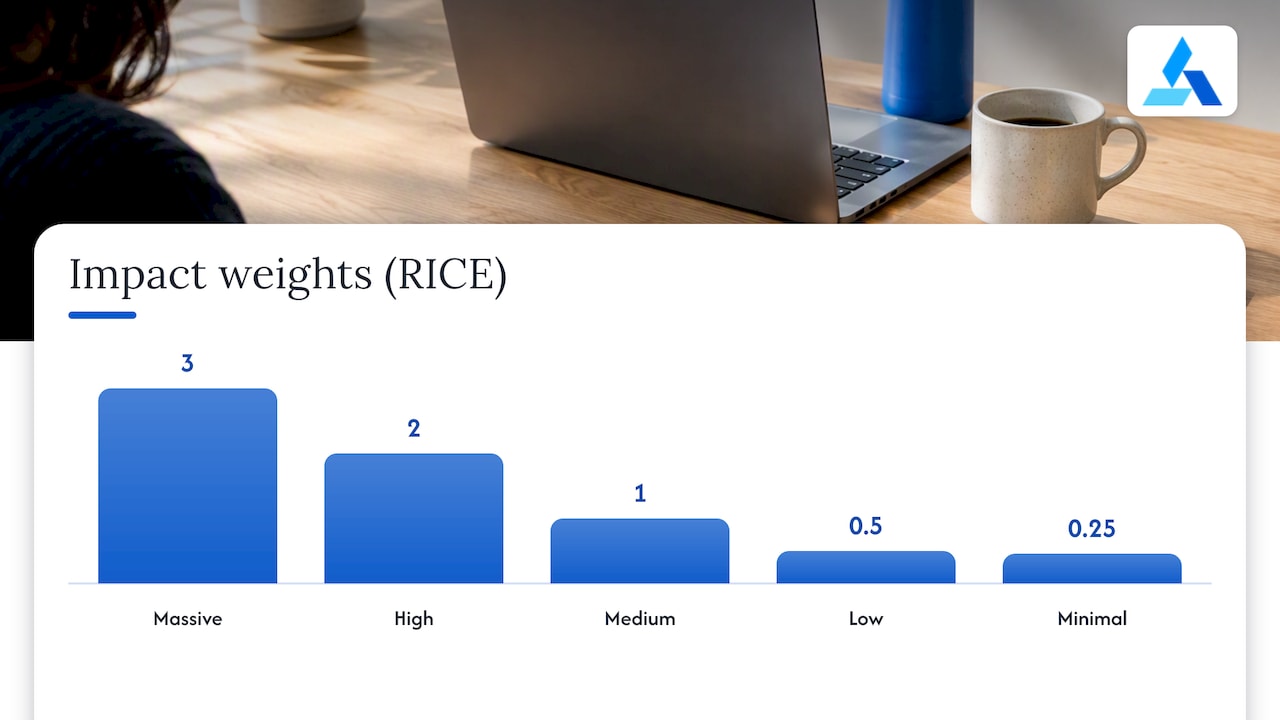
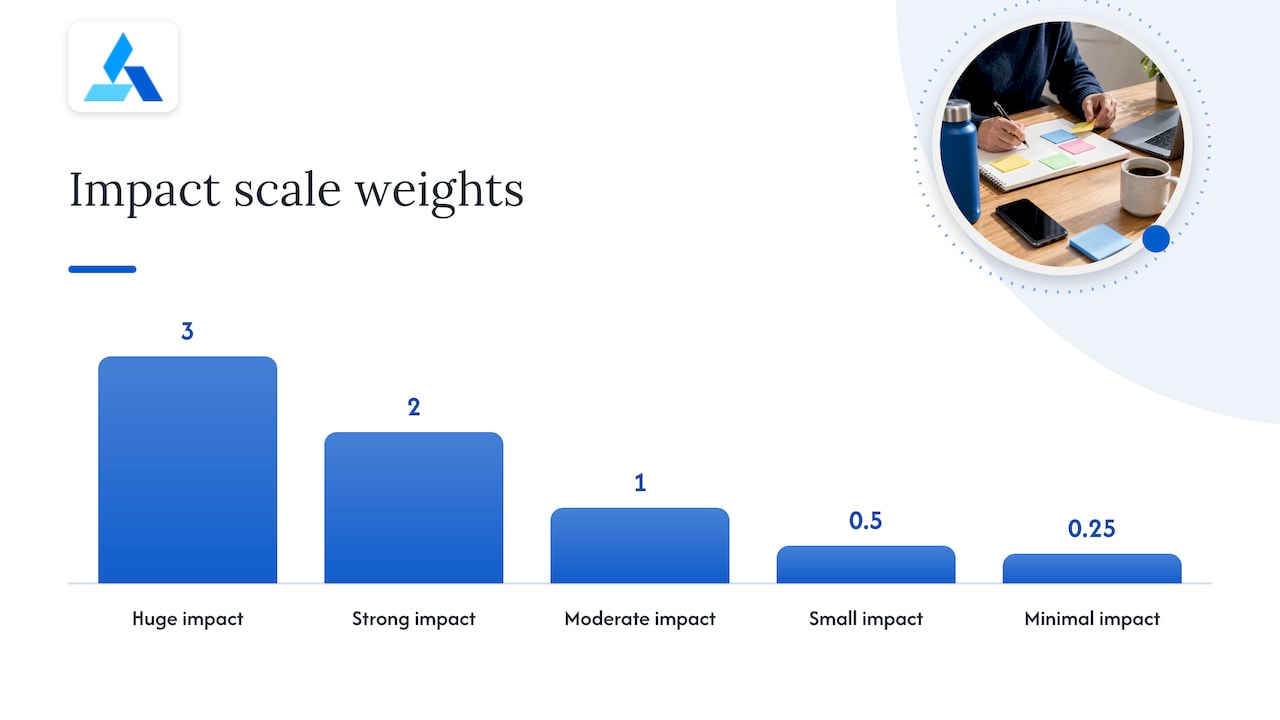
- Impact uses a coarse, multiple-choice scale: 3 for massive impact, 2 for high, 1 for medium, 0.5 for low, and 0.25 for minimal. Tie each number to a real metric, for example a conversion lift, a change in revenue per user, or a retention shift, so “high impact” means something specific rather than a feeling.
- Confidence is expressed as 100%, 80%, or 50%, with each tier tied to a concrete evidence bar. Use 100% when you have hard data (an A/B test, usage analytics), 80% when you have a strong but partial signal, and 50% when you are mostly guessing from a hunch or a single customer request.
- Effort is estimated in person-weeks or person-months, with a practical floor so nothing gets scored at a fraction of a person-week just to inflate its score.
If they can’t name one, the number drops to 80% or lower.*
Intercom’s own guidance is to keep every scale coarse rather than continuous. A five-point Impact scale and three-tier Confidence resist the temptation to fake precision that a free-form 1 to 100 slider invites.
Calculating a RICE score step by step, with a worked example
The calculation itself takes thirty seconds once the inputs are set. Getting the inputs right is the actual work.
- Pick the time window and the Reach metric first, before anyone estimates anything else
- Set Impact using the 3, 2, 1, 0.5, 0.25 scale tied to a named metric
- Set Confidence as 100%, 80%, or 50%, backed by named evidence
- Estimate Effort in person-weeks or person-months, with engineering input
- Compute (Reach × Impact × Confidence) ÷ Effort
Say a checkout redesign is projected to reach thousands of customers per quarter, with an Impact score of 2 (a solid but not massive conversion lift), Confidence at 80% based on a prior A/B test on a similar flow, and Effort estimated at several person-weeks.
(Reach × 2 × 0.8) ÷ Effort = score.
A RICE score has no universal pass or fail line. Tempo’s guide is clear that there is no fixed benchmark score; a 1,600 only means something next to the other items competing for the same quarter’s capacity. Rank the whole backlog, then work down the list until capacity runs out.
Log the evidence link and the date you scored each item alongside the number itself. Scores drift out of date as assumptions age, and a score with no paper trail is just an opinion with decimal points.
Templates for a RICE spreadsheet or ticket fields
A RICE table only needs a handful of fields. Padding it with extra columns nobody fills in is how spreadsheets stop getting used.
- Title: the initiative name, written the way you’d refer to it in a standup
- Reach, Impact, Confidence, Effort: the four inputs, each with its unit stated in the column header
- Score: the calculated output, ideally a formula cell so it updates automatically
- Evidence link: a document, dashboard, or test result backing the Confidence number
- Owner: whoever is accountable for the estimate, not just the person who typed it in
- Date scored: so stale estimates are visible at a glance
Quarterly roadmap templates tend to carry more columns (strategic theme, dependent teams, OKR alignment), while sprint backlog versions stay lean since the time horizon is shorter and the stakes per item are smaller. Both share the same core five fields.
| Field | Quarterly roadmap use | Sprint backlog use |
|---|---|---|
| Reach window | Per quarter | Per sprint or month |
| Impact scale | 3 / 2 / 1 / 0.5 / 0.25 | 3 / 2 / 1 / 0.5 / 0.25 |
| Confidence tiers | 100% / 80% / 50% | 100% / 80% / 50% |
| Effort unit | Person-months | Person-weeks |
If you run this in Jira, custom fields for Reach, Impact, Confidence, and Effort let the score calculate through an automation rule rather than a manual spreadsheet lookup. A plain spreadsheet with a formula column works just as well for smaller teams and avoids configuration overhead entirely.
Where RICE breaks down and how to guard against it
RICE multiplies four estimates together, and multiplying four guesses compounds whatever uncertainty was already in each one. LogRocket’s practitioner commentary calls this out directly: the resulting number looks precise, but it is only as reliable as its weakest input.
- Treat the score as a conversation starter, not a verdict; document the assumptions behind each number
- Enforce the Confidence evidence bar; a team that defaults everything to 80% has stopped scoring and started decorating
- Flag items with hard dependencies, regulatory requirements, or strategic bets as exceptions; RICE ranks comparable work, not mandatory work
- Build in confidence decay: a score not revalidated after a set period should step down automatically rather than sit untouched for a year
Pro Tip: Set a calendar reminder to revisit any item scored above your cutline every quarter. If nobody can point to new evidence, drop its Confidence a tier before the next ranking.
A partner guide from Netverge on structuring incident triage fields makes a similar point from the operations side: priority inflation creeps in the moment scoring loses its evidence requirement.
Running RICE inside real planning cycles
RICE works best on a cadence, not as a one-time exercise you run once and forget.
- Run full RICE scoring quarterly for strategic roadmap decisions, where the time window gives Reach and Impact estimates room to be meaningful.
- Use a lighter, faster version at the sprint level for urgent or reactive items, since a full quarterly review cycle is too slow for that scale of decision.
- Assign inputs to whoever actually has the data: analytics owns Reach, the product manager owns Impact, engineering owns Effort, and a researcher or data analyst owns Confidence where evidence requires investigation.
- Set a decision rule in advance, such as a minimum score cutline or a rule that ties get broken by lower Effort, so the ranking meeting does not turn into a renegotiation of the inputs.
- After shipping, monitor the metric the Impact score was supposed to move. If reality consistently misses the estimate, recalibrate your Impact scale rather than abandoning the framework.
Tempo’s guide backs the quarterly cadence as the common pattern among product teams, paired with lighter sprint-level checks for anything that cannot wait.
From idea capture to a validated roadmap: a lean workflow
A workable RICE process does not need much ceremony. Six steps cover it.
- Capture: log the idea with a title and a one-line problem statement
- Estimate: fill in Reach, Impact, Confidence, and Effort with named evidence
- Score: calculate automatically, whether through a spreadsheet formula or a Jira automation rule
- Review: rank the backlog against the current quarter’s goal in a shared session
- Schedule: slot the top-ranked items into available capacity
- Measure: track the real outcome against the Impact estimate after launch
Spreadsheets suit small teams and early-stage backlogs; Jira custom fields suit teams already living in tickets and want the score visible on the card itself; dedicated product-portfolio tools suit larger organizations juggling multiple roadmaps at once. None of these choices changes the math, only how much manual upkeep the evidence links and decay reminders need. A partner example from Zoney on displaying interactive roadmaps on shared screens is a useful illustration of keeping the ranked list visible to the whole team, not buried in a spreadsheet only the PM opens.
What ten years of scoring backlogs taught me about honest numbers
Three weeks into building it, we discovered the only evidence behind that number was a single sales call from eight months earlier. The score had been real precision dressed over a guess.
It slowed scoring sessions down by about ten minutes each time, and it quietly killed off a handful of pet projects that could not survive someone asking “where’s the evidence.”
Use RICE to structure a trade-off conversation, not to end one. The number tells you where to start arguing, not where to stop thinking.
FAQ
How do you interpret a RICE score?
A RICE score only means something relative to other items scored the same way in the same time window. Tempo’s guide notes there is no universal benchmark score; you rank your backlog from highest to lowest and work down it until capacity runs out.
How is the RICE score calculated?
Multiply Reach by Impact by Confidence, then divide by Effort, using the formula set out in Intercom’s original framework. Reach is measured in users or events per a fixed time window, Impact and Confidence use set scales, and Effort is measured in person-weeks or person-months.
What is the rule of 3 in prioritization?
This commonly refers to limiting a team’s active top-priority initiatives to a small, focused number at any one time rather than attempting everything in parallel. RICE supports that discipline by ranking the backlog so the top few items are the clear, evidence-backed choice rather than a negotiated list.
Is a higher or lower RICE score better?
A higher RICE score is better. It means more expected impact across more users per unit of effort, which is why ranked lists run from highest score down to lowest.
Sources
- RICE framework — GrowthMethod
- RICE: Simple prioritization for product managers — Intercom
- RICE score prioritization guide — Tempo
- RICE framework prioritization made simple — LogRocket Blog